
Case study · City of Wolverhampton Council
Seeing NO₂ hot spots in real time, on the network the city already had
Wolverhampton connected pollution monitors and journey‑time detectors straight into its existing NOW Wireless mesh network — no new circuits, no new power supplies — and gained a live, city‑wide picture of nitrogen dioxide and the traffic that causes it.
Headline results
The challenge
Hot spots above the annual NO₂ objective — and no live view of them
Wolverhampton had air quality issues linked to NO₂ (nitrogen dioxide) from road traffic, with a number of hot‑spot areas where the annual mean air quality objective was being exceeded. The council wanted a clear, real‑time picture of pollution in those areas — without spending tens of thousands of pounds per site on reference‑grade chemiluminescent analysers, and without waiting weeks for diffusion‑tube results.
The city already had more than 400 NOW Wireless mesh nodes providing secure communications to its on‑street equipment, including its traffic signal controllers. The question was whether that network could carry the sensors too.
What the council needed
- Live NO₂ readings at the hot spots, not an annual average
- Affordable sensors that could be deployed at many sites
- Journey‑time data alongside pollution, to see cause and effect
- No new communications circuits or power installations
- Data that could feed the council’s own city management platform
The project
Sensors that plug into the mesh
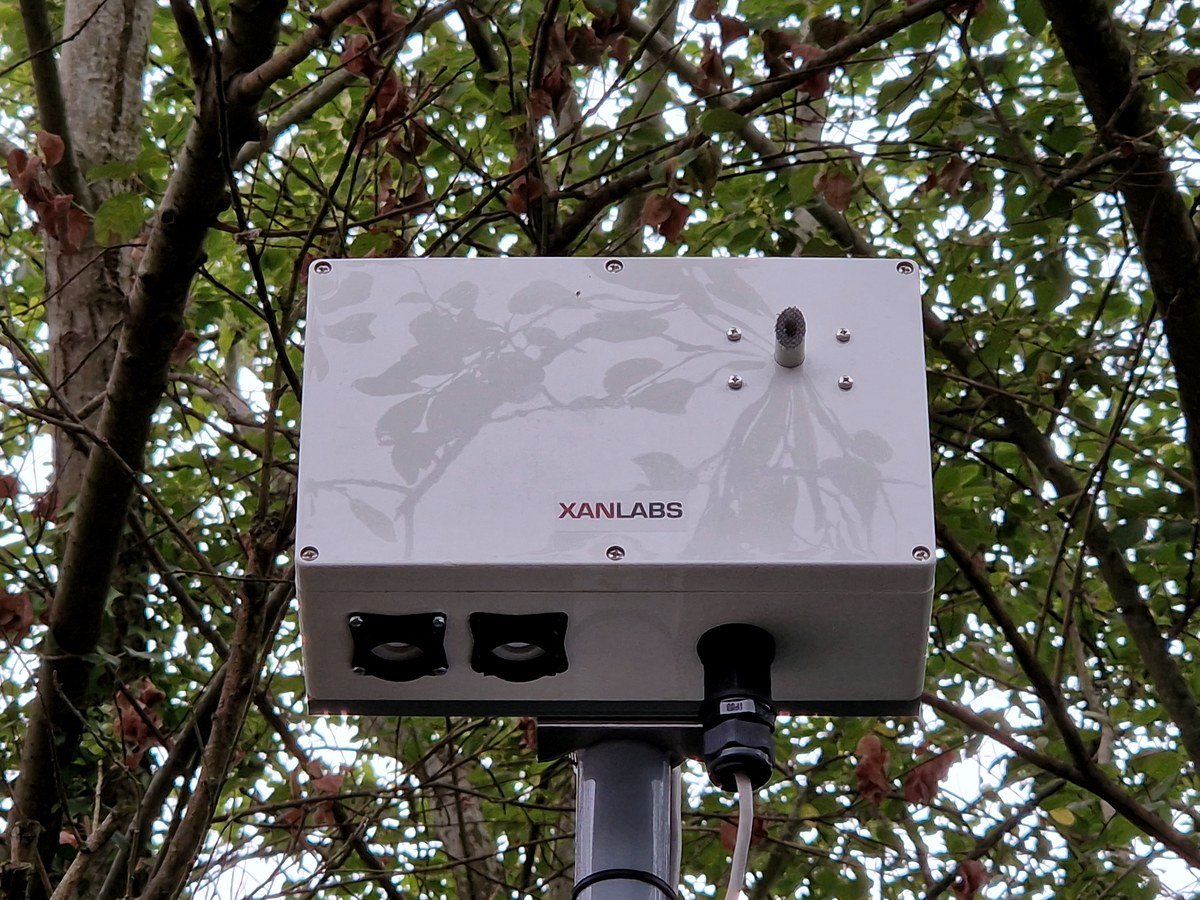
Using the existing mesh network, the council connected NOW Wireless pollution monitors and Bluetooth journey‑time detectors directly to its mesh nodes. The Intelligent Antenna and mesh node at each site provided both the power and the communications for the sensors — removing the cost of new circuits and power connections entirely.
The NO₂ detector records readings to the database and, if a reading passes a preset level, can raise an alert by email or text, write to a URL, or send data directly to the signal in‑station or outstation. The Bluetooth detectors track traffic as it passes through the city, so pollution can be read against journey time: as journeys lengthen, how does NO₂ respond? CCTV and video analytics classify the vehicles involved — heavy vehicles can produce around twice the NO₂ of cars, and idling engines cause spikes, both of which the AI can pick out.
Results are viewed live in SenseView, the NOW Wireless real‑time data platform, and exported into the council’s city management platform for wider use.
Each sensor draws power and communications from the mesh node already on the pole; readings flow to SenseView and on to the council’s own platform.
The outcome
A live picture of the whole city, and the detail at every site
In the first phase, five pollution sensors, 72 Bluetooth journey‑time sensors and 28 vehicle counters were integrated into the council’s platform, sampled every five minutes — roughly 30,000 data points a day. A second phase was planned to bring the total to 200 detection devices, around 60,000 data points a day and 22 million a year.
SenseView shows NO₂ at each monitored site — Bilston Road among them — alongside journey times on set routes, in real time. Because everything is recorded, the council can also look back: how pollution and journey times have moved as plans are put in place, and whether those plans are working.
The first actions were changes to signal timings and gating traffic outside the hot spots. Beyond that, the data opens up ways to change driver behaviour: routing drivers around pollution, warning of poor air quality near schools and drop‑off points, and publishing the quietest times to travel so that journeys shift rather than queue.
Phase 1 in numbers
- Pollution sensors
- 5
- Bluetooth journey‑time sensors
- 72
- Vehicle counters
- 28
- Sampling interval
- 5 minutes
- Data points per day
- ~30,000
- New circuits or power supplies
- 0
Mesh nodes already on the street carried every sensor.
What this means for you
If you have the network, the sensors are the easy part
Every mesh node is a powered, connected point on the street. Air quality, journey time, counting and AI can be added to it without a new circuit or a new supply, and read together in one place. See Smart City for the infrastructure, and Healthy Streets for how pollution data turns into action at the signals.
Talk to us
Put sensors where your hot spots are
Tell us which sites exceed the objective and we will show you what a first phase of monitoring looks like on your existing infrastructure.